
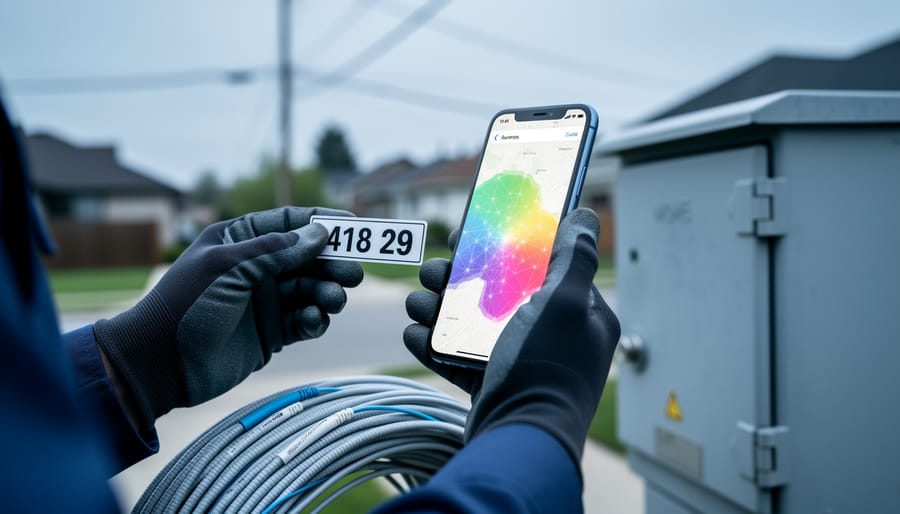
Fiber internet availability maps let you determine whether fiber optic broadband is accessible at a specific address by querying public databases and provider-submitted coverage data. The primary tool for North American users is the FCC broadband map, a searchable platform that displays coverage down to individual addresses rather than general ZIP codes or cities. This granularity matters because internet service providers often deploy fiber selectively, sometimes covering only certain blocks within a neighborhood while leaving adjacent streets unserved.
The mapping process relies on ISPs reporting their service footprints to regulatory authorities. For the FCC map, providers submit data showing where they offer traditional wired services like cable and DSL, newer technologies including fixed wireless access and fiber, and mobile 4G and 5G networks. Users can challenge inaccuracies when reported coverage doesn’t match ground truth, creating a feedback loop that improves data quality over time.
However, accuracy limitations persist. Provider websites frequently overstate their coverage areas, listing entire municipalities as served when actual availability extends to only a fraction of addresses. This discrepancy drives demand for independent verification tools and address-level searching capabilities. For Canadian communications professionals evaluating infrastructure deployment or competitive positioning, understanding both the capabilities and constraints of these mapping resources is essential. Maps are updated as providers expand networks and as challenges correct outdated information, meaning availability can shift substantially within a single fiscal year.
What Fiber Internet Availability Maps Show
Fiber internet availability maps display structured data about broadband service coverage at granular geographic levels. At their core, these tools show which internet service providers operate in specific areas, what connection technologies they offer, and the maximum advertised speeds available at searched locations.
The technology type indicators distinguish between multiple delivery methods. Maps classify traditional wired infrastructure, fiber-optic lines, coaxial cable networks, and legacy DSL connections, separately from wireless options. Fixed wireless access (FWA) and 5G home internet services appear as distinct categories because they deliver broadband without physical lines to the premises. This differentiation matters for telecommunications professionals evaluating network capabilities, since fiber typically offers symmetrical upload and download speeds while cable and DSL show asymmetric performance, and wireless technologies introduce latency variables that wired connections avoid.
Provider listings on these maps include company names alongside their reported service footprints. A single address might show availability from multiple ISPs using different technologies, one fiber provider, two cable operators, and several fixed wireless services could all appear for the same location. Maps display maximum advertised speeds for each provider-technology combination, though actual delivered speeds may vary based on network congestion and infrastructure condition.
Coverage areas appear at the address level rather than broad ZIP code zones. This precision reveals the block-by-block reality of service deployment, where one street may have fiber access while the next block over relies on older copper infrastructure. The address-level granularity exposes gaps that city-wide or postal code searches would obscure, showing service providers which neighborhoods lack modern connectivity and helping enterprises identify locations where specific technologies can support their operations.
How to Use the FCC Broadband Map for Fiber Availability
The FCC broadband map offers the most reliable public tool for checking fiber availability at a specific address in the United States. Unlike regional or provider-specific maps, this national database compiles service coverage data directly from internet service providers, giving you a comprehensive view of what technologies and companies serve any given location.
Searching by address delivers far more accurate results than checking by city or ZIP code alone. ISPs frequently cover only portions of a ZIP code or city, sometimes block by block, so an address-level query eliminates guesswork about whether your specific location falls within a provider’s footprint.
- Navigate to the FCC National Broadband Map website and locate the address search bar on the homepage.
- Enter the complete street address, including house or building number, street name, city, state, and ZIP code. The system requires this level of detail to return location-specific results.
- Review the results page, which displays all providers reporting service at that address. The map distinguishes between technology types: traditional wired options like cable and DSL, fiber providers, fixed wireless access (FWA), and mobile 4G and 5G services.
- Filter results by connection type to isolate fiber providers specifically. Look for listings that indicate fiber-to-the-premises (FTTP) or fiber-to-the-home (FTTH), which represent true fiber connections rather than hybrid technologies.
- Note the advertised speeds and service tiers each fiber provider reports for that address, keeping in mind these represent what providers have told the FCC they offer at that location.
The information you see comes directly from service provider submissions to the FCC. Providers report coverage data on a regular basis, though the accuracy depends on how precisely they’ve mapped their networks. If you spot incorrect information, such as a provider listed that doesn’t actually serve your address, the FCC map includes a challenge process that lets you report discrepancies. These challenges help refine the database and hold providers accountable for accurate coverage claims.
While the FCC map provides a solid starting point, treat results as a guide rather than definitive proof of service. The next step involves verifying availability directly with providers, particularly when planning significant connectivity decisions for enterprise locations or network infrastructure projects.
Understanding Map Limitations and Accuracy Issues

Fiber availability maps serve as valuable planning tools, but they carry inherent limitations that telecommunications professionals must understand. The primary challenge stems from how coverage data is collected and reported: service providers self-report their availability to mapping authorities, creating opportunities for discrepancies between mapped coverage and on-the-ground reality.
ISP websites and national maps sometimes overstate coverage, particularly in areas where infrastructure exists but active service connections face technical or economic barriers. A provider might report availability for an entire census block or street segment when only select addresses within that area can actually receive service. This block-by-block variation means that two properties on the same street may have entirely different connectivity options, despite appearing identical on broader coverage maps.
The gap between mapped availability and serviceable addresses creates particular challenges for enterprise decision-makers evaluating locations and service providers assessing expansion opportunities. ISPs often cover only portions of cities or postal codes, with coverage patterns following infrastructure deployment economics rather than administrative boundaries. Where fiber infrastructure requires data collaboration between multiple stakeholders, municipalities, utilities, and carriers, deployment timelines and coverage accuracy become even more complex.
The FCC broadband map addresses some accuracy concerns through its challenge and correction process, which allows users to report incorrect coverage information. When discrepancies are identified, providers must respond to challenges with documentation of actual service availability. However, this reactive correction mechanism means maps may contain outdated or inaccurate information until challenges are filed and resolved. Updates occur periodically rather than in real-time, so recent infrastructure deployments or service changes may not immediately appear in mapping tools.
Canadian Context: Fiber Mapping Tools and Resources
Canadian telecommunications professionals face a distinct challenge when evaluating fiber availability: the country lacks a centralized, address-level mapping tool equivalent to the FCC broadband map. The Canadian Radio-television and Telecommunications Commission (CRTC) maintains national broadband data, but its publicly available maps typically operate at a census subdivision or forward sortation area level rather than the street-address granularity common in U.S. tools. This means determining actual fiber availability at a specific business location or residential address requires more investigative work.
Individual provinces have taken varied approaches to mapping broadband infrastructure. Some maintain regional databases or interactive maps, while others rely on federal reporting. The Innovation, Science and Economic Development Canada (ISED) National Broadband Internet Service Availability Map provides a starting point, showing which areas have access to different speed tiers, but it doesn’t always differentiate fiber from other high-speed technologies. Service providers report coverage data to regulators, yet the methodology differs from the U.S. challenge-and-verify system, making accuracy disputes harder to resolve.
For organizations evaluating connectivity options or expansion opportunities, this fragmented landscape means cross-referencing multiple sources. A Toronto-based enterprise might check CRTC data, provincial resources, and individual ISP coverage checkers to build a complete picture. Understanding these differences matters particularly for companies operating on both sides of the border, what constitutes verified coverage in one jurisdiction may be reported differently in another.
The practical implication: Canadian telecom professionals should treat official maps as directional guidance rather than definitive answers. Direct contact with regional providers remains the most reliable verification method when precise fiber availability data determines business decisions or infrastructure investments.
Verifying Actual Fiber Availability Beyond the Map

Maps provide valuable starting points, but direct verification prevents costly assumptions about actual fiber service. ISPs frequently cover only portions of a ZIP code or city, sometimes block by block, which means mapped availability doesn’t guarantee service at your specific location.
Contact providers directly using their address qualification tools rather than relying solely on coverage maps. Most carriers maintain online serviceability checkers that query their network records in real time. When these tools return inconclusive results, call the provider’s business or enterprise sales team with your exact street address. Business account representatives typically access more detailed provisioning systems than residential support staff.
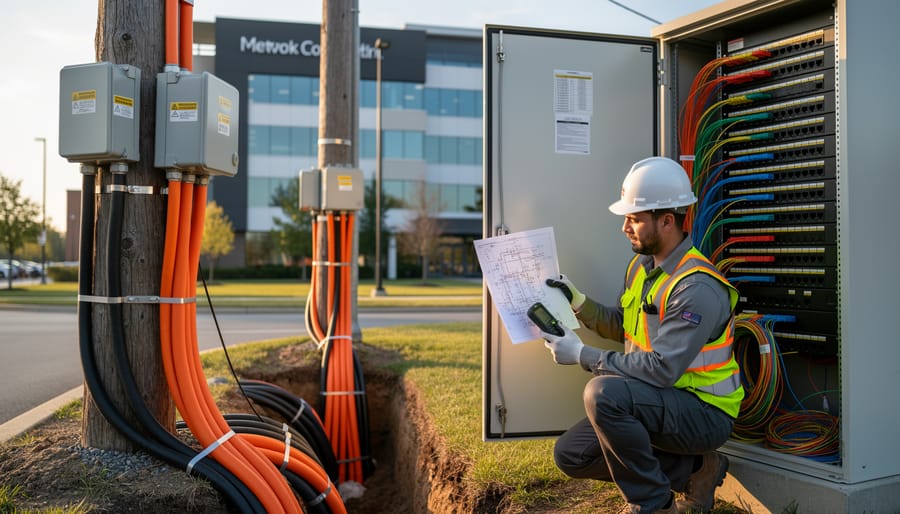
For service providers evaluating expansion opportunities, physical infrastructure assessment reveals actual fiber presence. Look for fiber splice enclosures on utility poles, labeled fiber distribution hubs in neighborhoods, or fiber-to-the-premises (FTTP) drop cables running to buildings. Municipal permitting records often show where carriers have installed conduit and pulled fiber, providing documentary evidence of network buildout.
Enterprise connectivity decisions require confirmation beyond what consumer-facing maps show. Request a formal site survey from carriers, which includes engineering assessment of service delivery options, anticipated installation timeframes, and committed service level agreements. If fiber isn’t available but you need reliable high-speed connectivity, consider whether you can improve WiFi speed with existing infrastructure while awaiting fiber deployment.
Request written confirmation of service availability dates and installation costs before making business decisions based on mapped coverage. ISP overstatements about coverage happen often enough that verification protects against planning failures.
Common Questions About Fiber Availability Maps
Fiber availability maps raise practical questions for communications professionals and consumers alike. Understanding how these tools work, and their limitations, helps you interpret coverage data more accurately.
How often are fiber availability maps updated?
The FCC broadband map updates regularly as service providers report changes to their coverage areas, though the exact frequency varies by provider. Cities can update and simplify their fiber internet service maps so users can easily see where service is available today, but some local maps may lag behind actual deployment.
What should I do if a map shows incorrect fiber availability information?
You can challenge incorrect data through the FCC’s formal challenge process, where service providers must respond to disputes about their reported coverage. This verification system helps improve map accuracy over time, though corrections may take several months to appear.
Why do different availability maps show conflicting fiber coverage for the same address?
ISP websites sometimes overstate coverage compared to official mapping tools, and providers may update their own sites faster than federal databases. When sources conflict, verify availability directly with the provider using your specific street address rather than relying on city or ZIP code searches.
How can a provider show fiber coverage in my city but not serve my address?
ISPs often cover only a portion of a city or ZIP code, sometimes block by block, based on infrastructure deployment patterns. The map shows where the provider has any presence, but address-level searches reveal whether your specific location has access, a critical distinction for enterprise connectivity planning and network security infrastructure decisions.
When evaluating fiber availability data, treat maps as starting points rather than definitive answers. The reporting structure behind these tools means coverage claims reflect what ISPs submit, not necessarily what independent verification would show. Cross-reference multiple sources, narrow your search to the address level rather than broader geographic areas, and contact providers directly when planning critical infrastructure deployments. This multi-layered approach compensates for the inherent limitations in self-reported coverage data and helps you distinguish between theoretical service areas and actual fiber availability at specific locations.
Fiber internet availability maps serve as essential planning tools for the Canadian communications industry, but they demand a verification-first approach. Service providers rely on these mapping resources to identify expansion opportunities and avoid infrastructure redundancies, while enterprises use them to evaluate connectivity options for operations requiring high-bandwidth solutions. The challenge lies not in accessing maps but in confirming their accuracy before making strategic decisions.
The FCC broadband map and emerging AI mapping tools have improved coverage visualization, yet provider-reported data still contains gaps and overstatements that affect planning precision. For Canadian telecommunications professionals, cross-referencing multiple sources and conducting direct provider verification remains the standard practice. Accurate fiber availability mapping benefits the entire ecosystem by reducing wasted site surveys, accelerating deployment timelines, and helping customers set realistic expectations about service options.
Treat availability maps as starting points rather than definitive answers. The most reliable approach combines digital mapping tools with on-ground verification and direct provider confirmation, ensuring that coverage claims translate into actual service delivery at specific locations.

